
The True Cost of UPI Payments for Merchants in India (2026 Guide)
Direct Answer
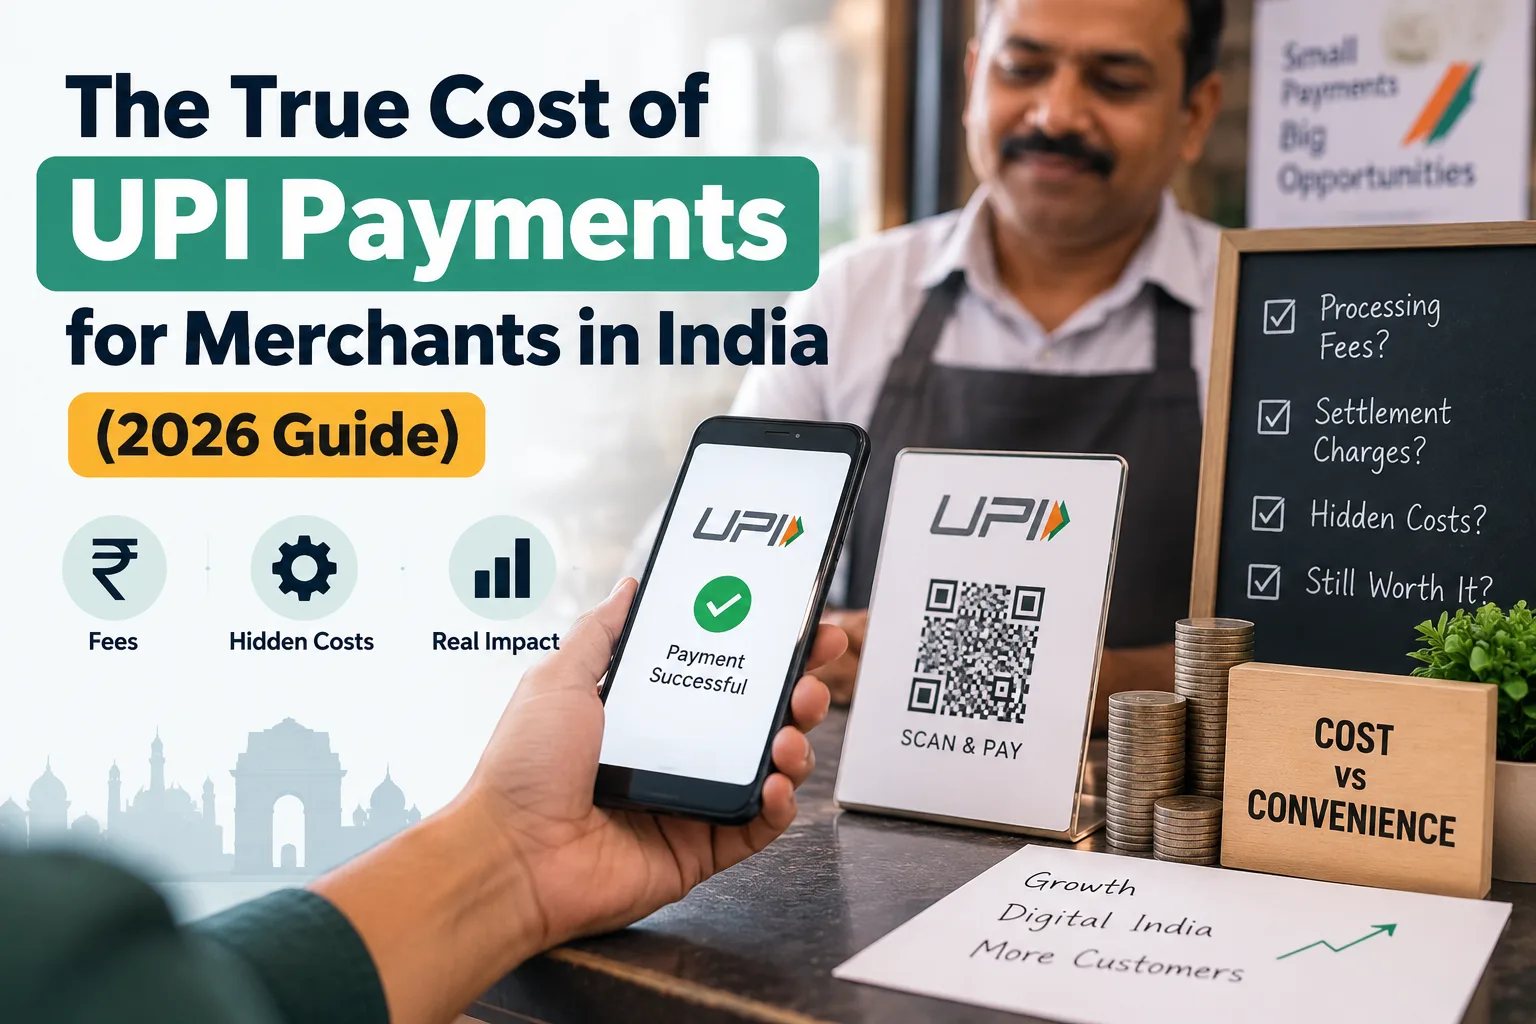
The true cost of accepting UPI payments in India includes far more than the headline MDR figure. Even where MDR is zero, merchants absorb costs from failed transactions, checkout abandonment, reconciliation work, and gateway platform fees. From October 15, 2026, a new 0.4% MDR applies to Person-to-Merchant (P2M) UPI transactions above ₹2,000, capped at ₹300 per transaction for values of ₹75,000 and above. Transactions of ₹2,000 or below — over 95% of all UPI P2M volume — remain free of MDR, as do small merchants under the P2PM framework (up to ₹1 lakh/month via UPI QR). Consumers are never charged. For most merchants, the bigger cost driver isn’t the fee — it’s the revenue lost to failed and abandoned payments.
Key Takeaways
- MDR is not the same as total payment cost. Gateway/platform fees, reconciliation work, and lost conversions from failed payments all sit outside the MDR line item.
- New rule, effective October 15, 2026: 0.4% MDR on UPI P2M transactions above ₹2,000, capped at ₹300 (applies to transactions of ₹75,000+).
- Most transactions are unaffected. UPI payments up to ₹2,000, and small merchants under the P2PM framework (receiving up to ₹1 lakh/month via UPI QR), remain at zero MDR. Select categories — railways, telecom, insurance, fuel — attract a flat ₹5 fee instead of the percentage-based MDR.
- Consumers pay nothing. NPCI has confirmed UPI app providers cannot pass MDR or platform fees on to customers.
- Failed payments are often the larger cost. A payment that never completes can cost a merchant the full order value — far more than 0.4% of it.
- The right metric is cost per successful payment, not cost per attempted payment or headline MDR.
Introduction: “But UPI Has Zero MDR. So Why Are We Still Paying for Payments?”
Imagine you run a fast-growing D2C brand.
Your monthly online sales have crossed ₹1 crore. UPI is your largest payment method. Your finance team reviews the payment gateway invoice every month and sees something reassuring: UPI MDR: 0%.
At first glance, the calculation seems obvious — if UPI costs 0%, it should be one of the cheapest ways to collect money.
But then you look at the actual economics of your payment stack.
And suddenly the question changes. It’s no longer “What is my UPI MDR?” It becomes: “What does it actually cost my business to successfully collect ₹1 from a customer?”
That’s the number merchants should care about — and it matters even more now. As confirmed by NPCI’s September 15, 2026 announcement, the Indian UPI ecosystem is moving away from a blanket zero-MDR framework for certain merchant transactions. A 0.4% MDR now applies to specified P2M UPI transactions above ₹2,000, effective October 15, 2026, with a ₹300 cap for transactions of ₹75,000 and above. Transactions up to ₹2,000 remain outside the standard MDR, and small merchants under the P2PM framework continue at zero MDR. Consumers are not charged this fee under any circumstances.
That means merchants now have two problems to think about:
- The explicit cost of processing a payment
- The hidden cost of getting that payment successfully completed
The second number is usually the more important one.
What Does “Zero MDR” Actually Mean?
Merchant Discount Rate (MDR) is the fee associated with processing a merchant payment, generally expressed as a percentage of transaction value.
UPI’s zero-MDR structure was introduced in January 2020 to encourage digital payment adoption, through amendments to the Payments and Settlement Systems Act, 2007 and the Income-tax Act, 1961. Government incentive schemes have separately supported ecosystem participants for low-value BHIM-UPI transactions — the 2026-27 Budget allocated roughly ₹2,000 crore for this subsidy, following ₹2,196 crore disbursed in 2025-26.
The important point: MDR is only one component of payment economics.
Transaction value
  − MDR
  − Gateway/platform charges
  − Operational payment costs
  − Revenue lost from failed payments
  − Reconciliation and support costs
  = Net economic value of the payment
A payment method with 0% MDR can still create a measurable business cost if it generates more failures, more operational work, or more lost conversions than an alternative. And a method with a visible fee can sometimes produce better economics if it delivers more successful transactions.
The goal isn’t finding the payment method with the lowest advertised fee. It’s understanding the cost per successful payment.
The 2026 UPI MDR Change: What Actually Changed
As of NPCI’s September 15, 2026 framework, effective October 15, 2026:
| Rule | Detail |
|---|---|
| MDR rate | 0.4% on P2M UPI transactions above ₹2,000 |
| Cap | ₹300 per transaction (applies from ₹75,000 upward) |
| Transactions ≤ ₹2,000 | Remain at zero MDR — over 95% of all UPI P2M volume |
| Small merchants (P2PM) | Zero MDR continues for vendors receiving up to ₹1 lakh/month via UPI QR |
| Consumer impact | None — UPI app providers are barred from passing MDR or platform fees to customers |
| Select categories (railways, telecom, insurance, fuel) | Flat ₹5 fee per transaction above ₹2,000, instead of the 0.4% rate |
| P2P transfers | Remain completely free, regardless of amount |
Illustrative MDR at 0.4%, capped at ₹300:
| Transaction Value | Illustrative MDR |
|---|---|
| ₹2,000 | ₹0 (below threshold) |
| ₹3,000 | ₹12 |
| ₹10,000 | ₹40 |
| ₹50,000 | ₹200 |
| ₹75,000+ | ₹300 (capped) |
For ecommerce specifically, this matters because average order values often sit comfortably above ₹2,000. A ₹3,000 order now carries ₹12 in MDR from mid-October 2026.
That doesn’t mean merchants should avoid UPI. It means the real question changes from “Should we stop accepting UPI?” to “How should our payment infrastructure control total cost while keeping UPI as a preferred checkout option?”
Why Gateway Fees and MDR Are Not the Same Thing
A common merchant misunderstanding is treating every payment charge as MDR. A payment gateway or platform typically charges separately for infrastructure around checkout, routing, orchestration, fraud controls, reporting, reconciliation, refunds, settlement visibility, APIs, and plugin support. These charges sit in your commercial agreement — separate from the regulated, network-defined MDR component.
The practical question isn’t “what’s my MDR?” It’s: “What am I paying for the entire payment infrastructure around each transaction?”
The UPI Cost Equation Merchants Should Actually Track
True Payment Cost = Direct Payment Fees + Operational Cost + Failure Cost + Revenue Leakage
Direct payment fees — MDR, gateway fees, platform fees, taxes, fixed transaction charges. Easiest to measure; they’re on your invoice.
Operational cost — the most underestimated line item. A payment succeeds at the bank but doesn’t immediately reflect in your order system. The customer contacts support. Support checks the transaction. Finance checks the settlement. Operations checks the order. Someone reconciles manually. No MDR was charged on any of this — but the business absorbed real cost.
Failure cost — a customer reaches checkout, selects UPI, the transaction fails, they retry, it fails again, they leave. There’s often no processing fee on a failed transaction — but the entire order may be lost.
Revenue leakage — if your average order value is ₹3,000 and a failed payment causes abandonment, the economic impact isn’t ₹0. It’s close to the contribution margin you would have earned.
The cheapest transaction isn’t the one with the lowest fee. It’s the one that delivers the best economics after conversion, processing cost, and operational overhead are all counted.
A ₹3,000 Order Shows Why the Percentage Alone Is Misleading
Consider a merchant with a ₹3,000 average order value and 10,000 attempted orders in a month — ₹3 crore of attempted transaction value.
At a 92% payment-success rate, that produces roughly ₹2.76 crore in successful payment value. The remaining ₹24 lakh represents attempted-but-unsuccessful value.
Even at minimal direct fees, those failed transactions represent a meaningful commercial opportunity. If better routing and checkout recovery raise the success rate by just a few percentage points, the financial effect is typically far larger than any fee saved through a lower MDR negotiation.
This is why payment economics should be measured at the checkout and transaction level, not the invoice level.
What Actually Causes a UPI Payment to Fail?
A UPI payment moves through several participants and systems:
Customer → Checkout → Payment Gateway/PSP → Acquirer →
UPI Network → Issuer Bank → Customer Account →
Transaction Confirmation → Merchant Order System
Each layer can introduce friction: issuer-bank issues, PSP availability problems, network timeouts, authentication failures, bank-side technical errors, transaction limits, risk controls, API timeouts, callback delays, or reconciliation mismatches.
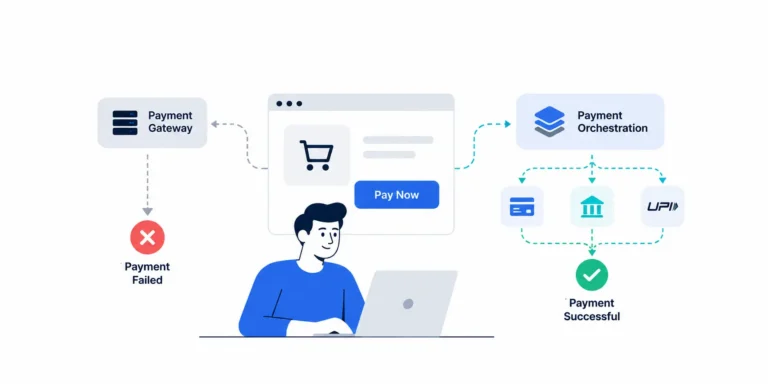
The merchant can’t control every component — but can control how the payment infrastructure responds when one path underperforms. That’s the core logic behind payment orchestration.
The Hidden Cost of a Failed Payment
Take a merchant receiving 100,000 payment attempts per month at a ₹3,000 average order value — ₹30 crore in potential gross transaction value.
If 3% of otherwise-valid attempts fail in a way that causes abandonment, that’s 3,000 potentially lost orders — ₹90 lakh in attempted sales.
Not every failed transaction would have converted regardless of the payment outcome. But even if only a portion represented recoverable demand, the opportunity is substantial — and dwarfs what most merchants would save from shaving a few basis points off MDR.
A basis-point saving is measurable. A lost customer is also measurable. They shouldn’t be treated as equivalent metrics.
Payment Success Rate Is an Economic Metric
Most merchants track MDR, gateway fee, settlement time, and transaction volume. Fewer track payment success rate, failure rate and reason, issuer-bank response, PSP performance, retry rate, recovery rate, payment-method conversion, and checkout abandonment.
The payment layer sits directly between customer intent and revenue realization — a customer who reaches checkout has already shown meaningful purchase intent. It should be measured as part of the revenue funnel, not treated as a back-office cost line.
Why Smart Routing Changes the Real Number
Imagine three payment providers:
- Gateway A — lower commercial rate, strong performance for certain banks, weaker for others
- Gateway B — slightly higher cost, better performance during specific traffic periods
- Gateway C — different commercial structure, stronger performance for particular payment methods or transaction profiles
A single-gateway strategy sends everything through one door. A multi-gateway strategy uses available infrastructure more deliberately. Smart routing goes further — using defined rules and real-time payment intelligence to decide where each transaction should be attempted, based on payment method, issuer bank, transaction type, gateway availability, historical performance, response codes, transaction value, provider health, and retry eligibility.
The goal isn’t distributing transactions evenly — it’s routing them intelligently.
Load Balancing vs. Smart Payment Routing
Load balancing distributes transactions by fixed ratio (e.g., 50/30/20 across gateways) without responding to real-time performance.
Smart routing considers payment context dynamically:
Customer selects UPI → Issuer = Bank X →
Gateway A currently performs best for Bank X → Route to Gateway A
(If Gateway A is unavailable → Fallback to Gateway B)
This turns payment infrastructure into a decision-making layer, not just a pipe.
What Is Payment Orchestration?
Payment orchestration is the infrastructure layer that manages multiple payment providers through a single, unified integration — coordinating routing, fallback, payment methods, transaction data, reconciliation, reporting, and performance monitoring.
                 CUSTOMER
                     │
              SMART CHECKOUT
                     │
          PAYMENT ORCHESTRATION
        ┌────────────┼────────────┐
    GATEWAY A    GATEWAY B    GATEWAY C
        └────────────┼────────────┘
                ACQUIRERS → BANKS
                     │
             PAYMENT CONFIRMATION
                     │
             MERCHANT SYSTEM
The merchant integrates once. Behind the scenes, the orchestration layer coordinates multiple payment paths.
Why Routing Can Matter More Than Saving 10 Basis Points
On ₹10 crore in monthly volume, a 0.10% cost difference equals ₹10 lakh/month — a real number. But if a routing and recovery strategy reclaims even ₹20 lakh worth of otherwise-lost transactions, the merchant needs to weigh both effects together.
This doesn’t guarantee a specific improvement for every business. It means the decision should be evaluated on:
Cost per successful transaction — not cost per attempted transaction.
The Real Merchant Metric: Cost Per Successful Payment
Compare two providers:
| Provider A | Provider B | |
|---|---|---|
| Processing cost | ₹8/transaction | ₹6/transaction |
| Success rate | 94% | 89% |
At face value, Provider B looks cheaper. But across 100 attempts, Provider A produces ~94 successful payments; Provider B produces ~89. The right comparison is total cost ÷ successful transactions — not the sticker price per attempt. The same principle applies to UPI: even at a low or zero headline MDR, the total system cost of collecting revenue is what matters.
Customer Psychology Makes Payment Failures More Expensive
A payment failure isn’t only a technical incident — it can become a trust incident. A customer who has added items to cart, entered their address, applied a coupon, selected UPI, approved payment, and then hit a confusing failure message doesn’t always think “I’ll retry.” Often the reaction is “maybe this site isn’t reliable” — especially for first-time customers. A good payment experience reduces uncertainty and gives customers a clear path to recover, not just a generic error.
The Role of Smart Checkout
Routing alone doesn’t solve every payment problem — the experience before and after the payment attempt matters too. Smart checkout reduces friction through faster address entry, a simplified flow, relevant payment methods shown first, clear payment status, better retry experiences, and intelligent COD controls. The goal is reducing unnecessary steps between intent → payment → confirmation.
Connected Banking and the Post-Payment Problem
The payment isn’t finished when the customer clicks “Pay.” The merchant still needs to know whether the transaction succeeded, where the money settled, which gateway processed it, which bank account received it, and whether the order status matches the payment status.
Without the right infrastructure, this information fragments across gateway dashboards, bank statements, internal order systems, and accounting systems. Connected banking brings visibility across these systems, reducing manual reconciliation and making true payment economics easier to see.
Payment Intelligence: From “Did It Succeed?” to “Why?”
The next step is moving from payment processing to payment intelligence — asking not just “did this payment succeed?” but “why did it succeed,” “why did the last one fail,” “which provider performs better for this segment,” and “where are we losing revenue?”
Transaction data → Payment performance → Failure analysis →
Routing decisions → Better payment path → More data → Better intelligence
This feedback loop is the foundation of increasingly adaptive payment infrastructure.
A Practical Merchant Example
A Shopify electronics brand with a ₹4,500 average order value accepts UPI, cards, net banking, and wallets through a single payment gateway. The team notices UPI drives a large share of transactions, certain bank segments fail more often, failures spike during traffic surges, finance spends hours weekly reconciling settlement reports, and support fields recurring payment-status queries.
The instinct is often to negotiate a lower fee. The bigger opportunity is usually elsewhere — across five layers:
- Cost — what does each successful transaction actually cost?
- Performance — which gateway performs best per segment?
- Recovery — what happens after a first-attempt failure?
- Operations — how much manual reconciliation is required?
- Customer experience — how many customers abandon after a failure?
Only after reviewing all five does the merchant have a complete picture of payment economics.
Myth vs. Reality
| Myth | Reality |
|---|---|
| UPI has zero MDR, so it’s free | MDR is only one component of total payment economics |
| The cheapest gateway is always the best option | Success rate and recovery materially affect total cost |
| Payment failure is a bank problem | Merchant payment architecture shapes how failures are handled |
| One gateway is simpler | Simple to integrate, but creates concentration risk |
| More gateways automatically improve payments | Multiple providers need intelligent routing and monitoring to help |
| A successful payment means the process is complete | Settlement, reconciliation, and order confirmation still matter |
| Payment cost is only a finance metric | Payment performance directly affects conversion and revenue |
Common Mistakes Merchants Make When Comparing Payment Gateway Charges
1. Comparing only MDR. It’s the easiest number to compare, but it excludes failed transactions, recovery, operational work, settlement complexity, and support cost.
2. Ignoring failed-transaction value. Merchants often calculate cost against successful GMV only. The better question: how much value entered checkout but never became successful payment value?
3. Treating all gateways as equal. Performance varies by bank, payment method, traffic pattern, transaction value, and merchant category — a static comparison misses this.
4. Routing everything through one provider. This creates concentration risk; if that provider degrades, the merchant has limited fallback.
5. Measuring only success rate. Success rate matters, but should sit alongside cost, refunds, settlement, reconciliation, fraud, and customer experience — not be optimized in isolation.
How to Calculate Your Own True Payment Cost
- Monthly payment attempts — e.g., 100,000
- Successful payments — e.g., 92,000
- Total payment fees — e.g., ₹7,36,000
- Payment-related operational costs — e.g., ₹1,50,000
- Recoverable lost transaction value — e.g., ₹20,00,000
- Contribution margin — use your actual business margin, not assumed 100% profit on lost GMV
Effective Payment Cost = (Direct fees + Operational costs + Attributable failure/recovery cost) ÷ Successful payment value or count
The exact formula should match how your finance team defines payment cost and contribution margin — the important thing is applying it consistently across providers and time periods.
What to Ask Your Payment Provider
- What exactly is included in the quoted MDR?
- Are there platform or processing charges beyond MDR?
- What taxes apply to service charges?
- Are there fixed transaction fees?
- How are failed transactions handled?
- Is smart routing available?
- Can transactions route across multiple gateways?
- Is automatic fallback available?
- Can performance be analyzed by issuer bank?
- How quickly can payment status be reconciled?
- How are settlement mismatches handled?
- Can transaction data be exported?
- What reporting is available?
- What happens during a gateway degradation event?
- How does the platform distinguish a true failure from payment-status uncertainty?
These answers usually reveal more about real cost than any headline MDR figure.
Where FastFlowPe Fits
For merchants evaluating the economics of payment acceptance, FastFlowPe treats payments as infrastructure rather than a single gateway connection. Its orchestration layer connects multiple payment providers through one integration and supports intelligent routing across available paths:
- Payment Orchestration — manage multiple providers through a single layer
- Smart Routing — route transactions based on configured logic and live provider performance
- Multi-Gateway Routing — reduce dependence on any single payment path
- Smart Checkout — optimize the customer-facing payment experience
- Payment Intelligence — use transaction-level data to understand performance and failure patterns
- Connected Banking — unify payment and banking visibility for faster reconciliation
No payment architecture eliminates every failure. The goal is infrastructure that helps merchants respond intelligently to payment performance and reduce avoidable revenue leakage — the actual outcome depends on implementation and provider availability.
The Future: From Cheapest Payment to Smartest Payment
Payment infrastructure is trending toward orchestration, real-time routing, AI-assisted decisioning, predictive performance, automated reconciliation, connected banking, checkout intelligence, and transaction analytics — combined rather than siloed.
The question merchants asked historically was “which gateway should we integrate?” Increasingly it’s: “How should our payment infrastructure decide where and how each transaction is processed?” That’s a fundamentally bigger question — and AI-assisted routing, which analyzes patterns across issuer banks, payment methods, transaction amounts, time of day, and historical success, is the direction that answer is heading.
Merchant Checklist: Is Your Payment Stack Cost-Optimized?
Payment Cost
- Do we know our actual MDR by payment method?
- Do we understand every platform and processing fee?
- Do we know our effective cost per successful payment?
Payment Performance
- Do we track success rate by issuer bank and gateway?
- Do we monitor provider performance over time?
- Do we measure recovery after a failed payment?
Routing
- Do we use more than one payment provider where it makes sense?
- Can transactions route intelligently, with fallback?
Checkout
- Is the payment experience fast, with minimal steps?
- Are failures communicated clearly, with an easy retry path?
Operations
- Are payment and order statuses synchronized?
- Are settlements reconciled automatically?
Business Impact
- Do we know how much payment value fails each month?
- Do we calculate cost against successful transactions, not attempts?
If several boxes are unchecked, your payment stack is likely costing more than the gateway invoice shows.
Frequently Asked Questions
Not entirely. UPI merchant payments up to ₹2,000, and small merchants under the P2PM framework, remain at zero MDR. From October 15, 2026, a 0.4% MDR applies to specified P2M UPI transactions above ₹2,000, capped at ₹300. Even where MDR is zero, merchants can still incur gateway, operational, and revenue-leakage costs.
Because MDR is only one component of payment economics. Your commercial agreement may include gateway or platform charges, and you can incur indirect costs from failed payments, reconciliation, and support. The right approach is calculating your total cost of successful payment collection, not just MDR.
It varies by applicable MDR, merchant category, provider agreement, transaction value, failure rate, and operational overhead. Merchants should calculate their own effective payment cost using actual transaction data rather than relying on a headline percentage.
Routing lets merchants select between providers based on rules and real-time performance signals — sending transactions to whichever provider is currently performing best for that payment method, bank, or transaction profile — improving the economics of successful collection rather than just the advertised rate.
Payment success rate, failure rate and reason, gateway and issuer-bank performance, payment-method conversion, retry and recovery rate, settlement time, reconciliation exceptions, support volume, and cost per successful transaction.
No. NPCI has confirmed UPI app providers are barred from levying platform fees or passing MDR costs to consumers. The charge applies only within the merchant payment ecosystem.
Conclusion: Stop Measuring Payments Only by the Fee
“Zero MDR” sounds like the end of the payment-cost conversation. It’s actually the beginning — because a payment can carry zero MDR and still cost your business through failed transactions, lost conversions, customer abandonment, support queries, reconciliation work, settlement complexity, and gateway dependency.
As India’s UPI ecosystem moves toward a more differentiated MDR structure for specified merchant payments, understanding these economics matters more, not less.
The smartest question isn’t “which provider has the lowest fee?” It’s: “which payment setup helps us successfully collect more revenue at a sustainable total cost?”
That requires visibility, measurement, and increasingly, intelligent infrastructure. For growing merchants, payment orchestration sits between the checkout experience and the underlying payment providers — enabling multiple payment paths, smarter routing logic, better visibility, and unified payment operations.
The goal isn’t simply cheaper payments. The goal is better payment economics.